After COVID-19: The long haul back
This post was originally published on SCN Australia.
Australian shopping centres have at last commenced the long haul back from the gloom of the COVID-19 shutdown. The question now is how long will it take to return to ‘normal’ and furthermore what will the new normal look like? GapMaps has been at the forefront of device data usage for analysis of customer patterns at shopping centres and retail precincts for a number of years, not just in Australia but globally. In this article, Tony Dimasi shares his insights on shopper visitation from data collected by GapMaps.
It is still early days to be making definitive pronouncements about the likely date of return to ‘normal’ for shopping centres or to be able to say with confidence exactly what the new normal will look like.

Chart 1 shows the longer-term visitation trends for each centre type, commencing in September 2019.
Chart 1: Daily unique visitors index by centre type, long term
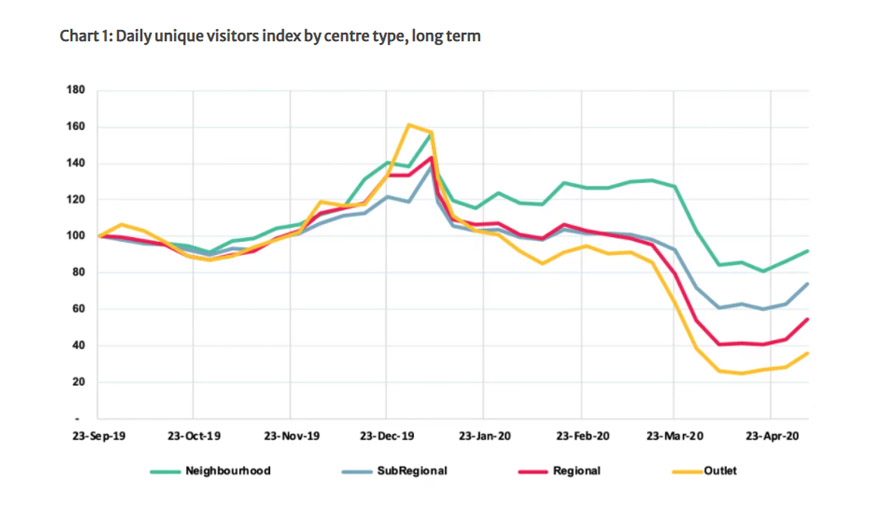
Chart 2 shows in greater detail the COVID-19 impacts, commencing in the week ending 20 January 2020 (when the first case of the virus was diagnosed in Australia) through to the week ending 11 May 2020. Along this timeline the key inflection points were the period around 13 March 2020 when gatherings of 500 people or more were prohibited and then 25 March 2020 when Stage 3 lockdown measures were imposed in all states.
Chart 2: Daily unique visitors index, COVID-19 Period
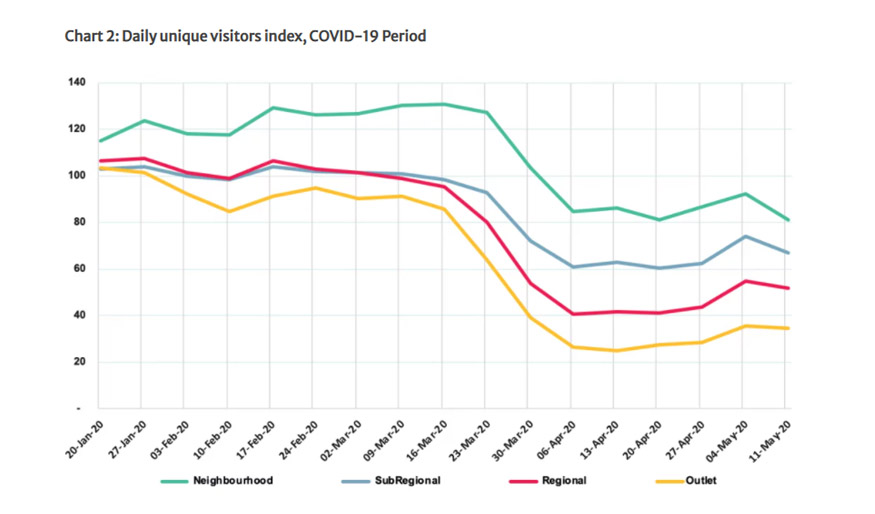
Unsurprisingly, neighbourhood centres have been the least affected while outlet centres, offering the most discretionary shopping experience, have been the most affected.
“At the trough of the shutdown impact, which occurred around mid-April, the percentage reductions in visitor numbers ranged from 20% for neighbourhood centres to about 75% for outlet centres. Regional centre visitation on average dropped to about 40% of pre-COVID-19 levels.”
“At the trough of the shutdown impact, which occurred around mid-April, the percentage reductions in visitor numbers ranged from 20% for neighbourhood centres to about 75% for outlet centres. Regional centre visitation on average dropped to about 40% of pre-COVID-19 levels.”
A further breakdown of the performance by centre type is presented in Charts 3 – 5, showing the variations on a state by state basis for regional centres, sub-regionals and neighbourhood centres respectively.
Chart 3: Daily unique visitors index – Regional Centres
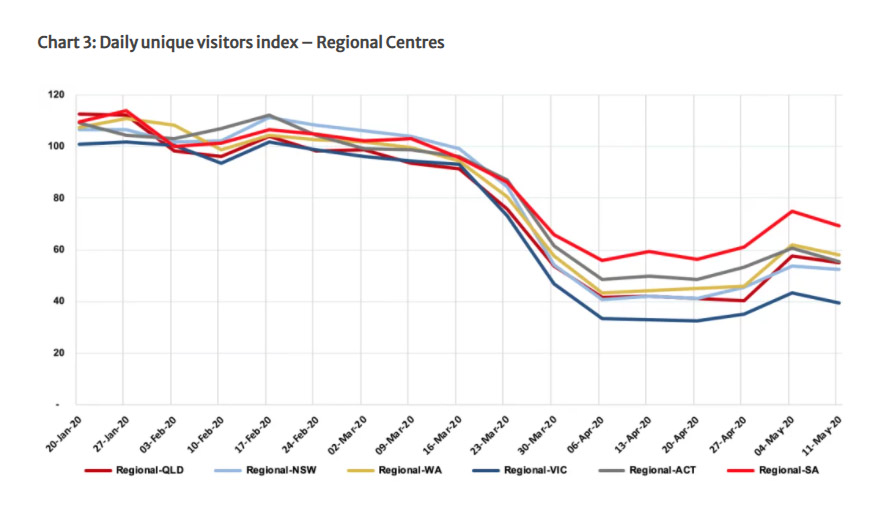
Chart 4: Daily unique visitors index – Sub-regional Centres
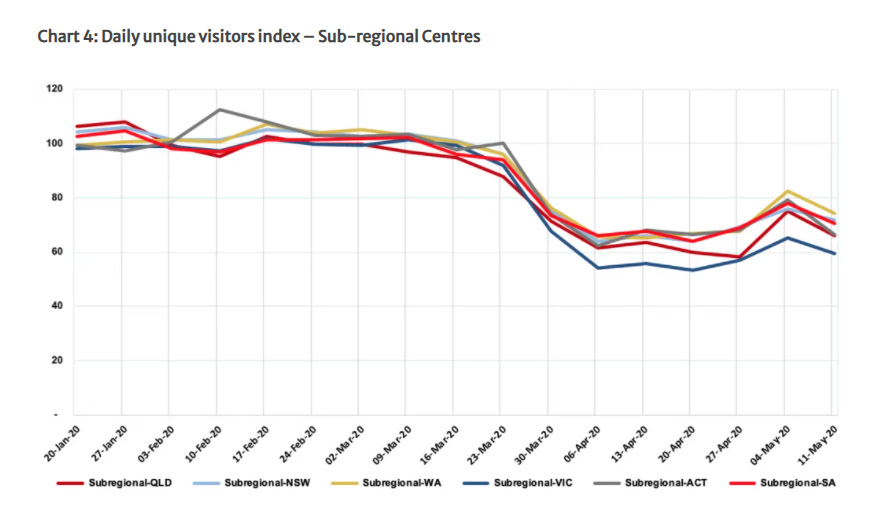
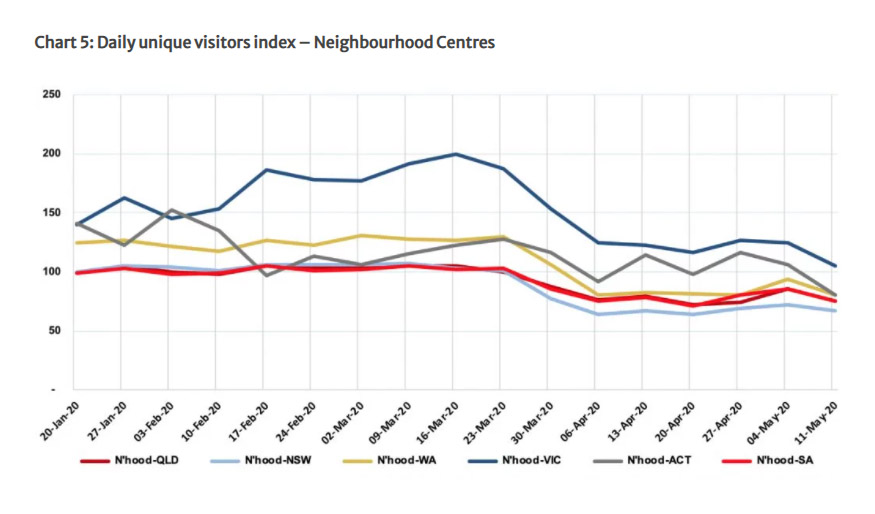
One interesting feature that is highlighted in the charts above is the important role of the neighbourhood centre broadly but especially in Victoria over the lockdown period, and the evidence of panic shopping around mid-March primarily via neighbourhood centres, of which Victoria has many. What is also apparent is that visitation levels for regional and sub-regional centres generally fell more dramatically across Victorian centres.
Chart 5: Daily unique visitors index – Neighbourhood Centres
Mobile device data offers great flexibility because every observation is date stamped and contains both a point of origin (anonymised) and a destination – the destination being the shopping centre or area selected for analysis. Therefore, these data can be used very effectively to measure not just the broad changes in total visitation patterns but also the changes which have occurred by place of origin (e.g. trade area sector) and by time of day or day of the week.
“Mobile device data offers great flexibility because every observation is date stamped and contains both a point of origin (anonymised) and a destination – the destination being the shopping centre or area selected for analysis.”
Chart 6 shows, for example, that one of the outcomes of the restrictions on shopping movements imposed as a result of COVID-19 has been a desire to stay closer to home, thus the proportion of total centre customers who live within a distance of five kilometres of the centre has increased quite significantly across all centre types.
Chart 6: Share of daily unique visitors: 0 – 5 km
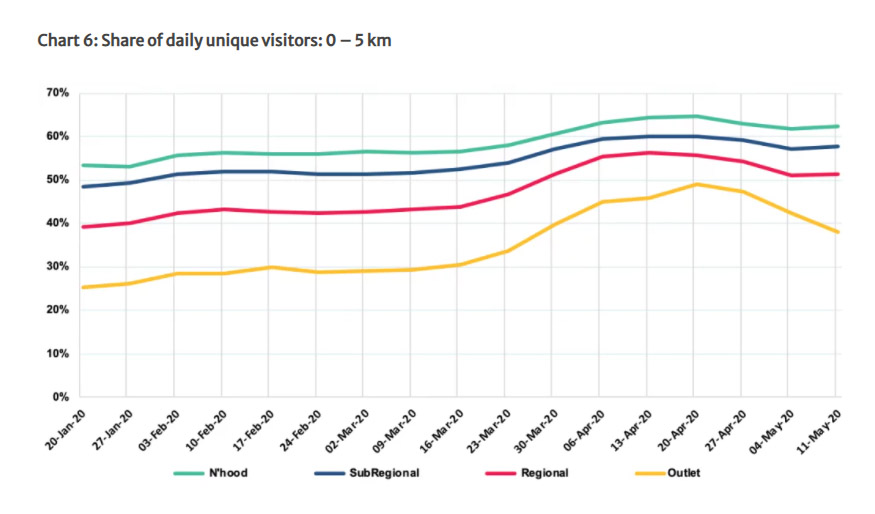
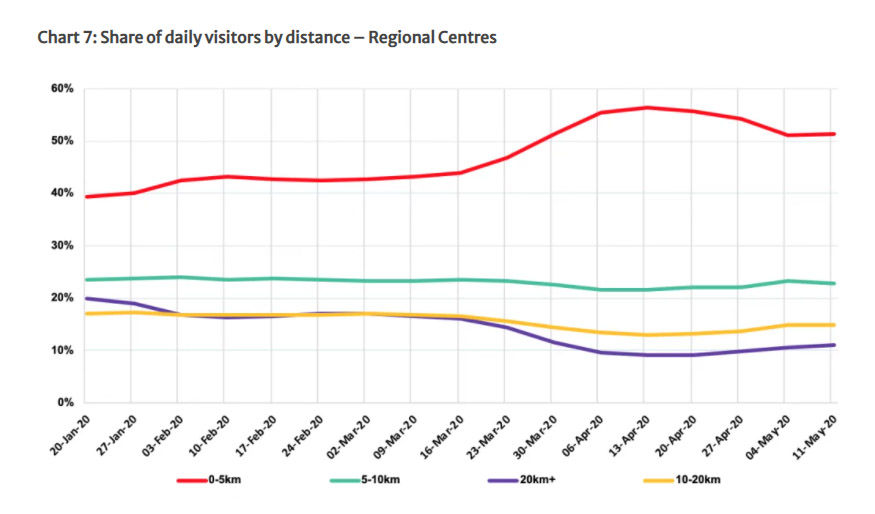
Chart 7 shows in greater detail the specific changes by origin for regional centres, highlighting the increase in share of daily visitors coming from five kilometres or less offset by significant decreases in share of those driving distances greater than 10 km.
Chart 7: Share of daily visitors by distance – Regional Centres
The device data can also be used to examine changes in visitor patterns by time of day, as Chart 8 shows, again for regional centres.
Chart 8: Share of daily visitors by time of day – Regional Centres
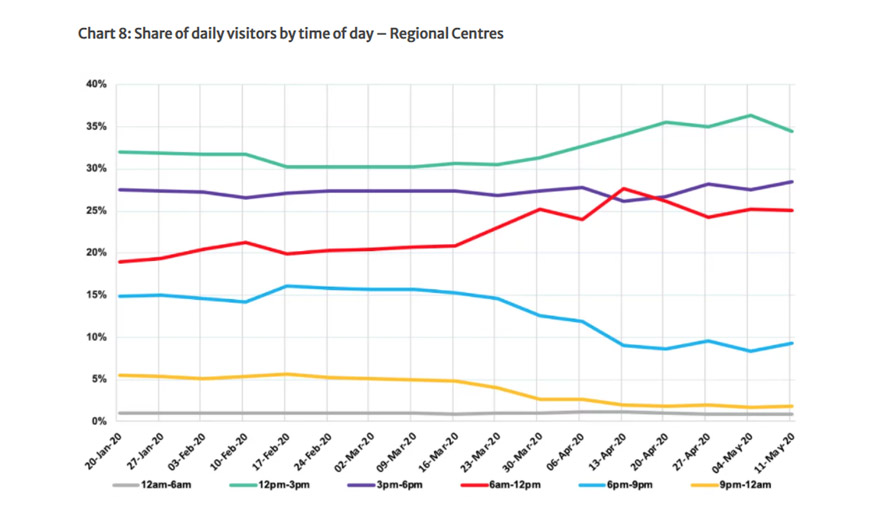
During the shutdown shoppers visiting regional centres clearly concentrated those visits into the morning period to a much greater extent than was previously the case, while correspondingly early afternoon visits and late evening visits have fallen off significantly.
Mobile device data offer the opportunity to continue tracking the recovery period, to understand the nature of the changes and also whether or not visitation patterns are transitioning back to the old normal or will settle into some form of new normal, for each type of centre.
Importantly, mobile device data can also be utilised for any specific centre to measure any or all of the above, and then to compare or contrast that centre’s performance with the relevant benchmarks for its peer centres.