After COVID-19: The long haul back – Part 2
This post was originally published on SCN Australia.
In the last part of this series, Tony Dimasi reported on the early results in visitation patterns evident from GapMaps analysis of personal mobility data as Australia’s shopping centres tentatively re-opened following the progressive easing of government-imposed restrictions in each state. In this follow-up assessment, Tony examines the progress that centres have been making in the first month of what will no doubt be a long and painful recovery period.
There is, however, an increasingly wide array of information available to help us understand where we are on the path back to recovery and one conclusion that can be drawn with some confidence, I believe, is that much of the ground lost by shopping centres during the lockdown period has already been recovered.

Personal mobility data collected via smartphone usage, often referred to as device data or mobile device data, is one such source of information, providing a powerful and insightful tool to measure the changes in visitation patterns, both negative and positive, almost in real-time. GapMaps’ device data provide a clear picture of what has happened to shopper visitation levels both during the lockdown period and in the various phases of recovery.
For the purpose of comparison pre-COVID-19 ‘normal’ is defined as the pre-Christmas period last year, ie. September 2019, and weekly tracking of visitation levels, for each type of shopping centre, has been undertaken up to Friday, 27 June 2020. The benchmark data presented below reflects the aggregated findings across 100 regional centres, 100 sub-regional centres, 150 neighbourhood centres and nine outlet centres, thereby providing a robust view of what has been happening across each level of the shopping centres’ hierarchy.
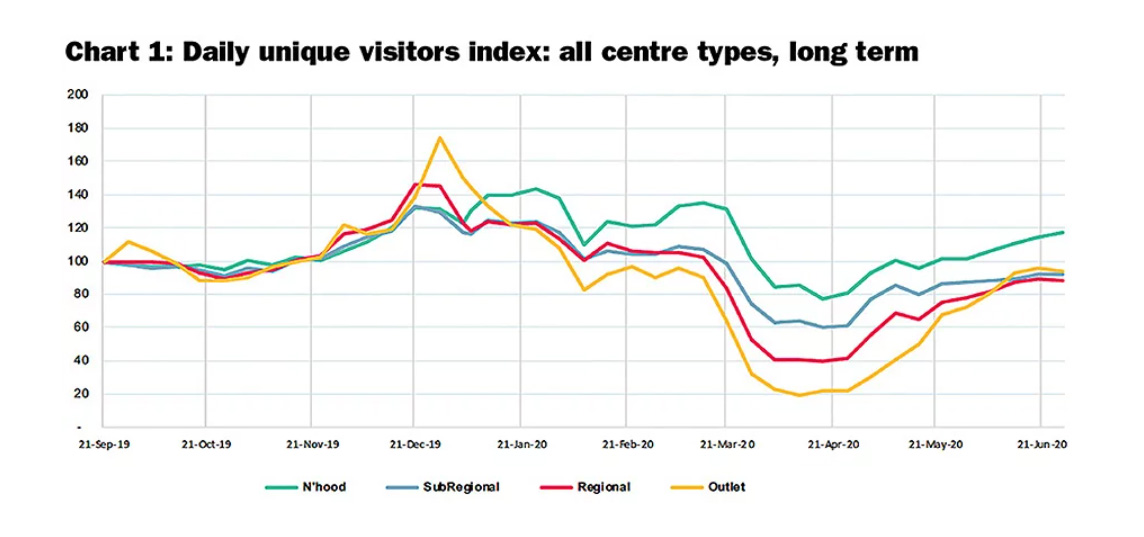
Chart 1 shows the longer-term visitation trends for each centre type, commencing in September 2019.

Chart 2 shows in greater detail the COVID-19 impacts, from the week commencing 20 January 2020 (when the first case of the virus was diagnosed in Australia) through to the week commencing 29 June 2020.
Along this timeline, the key inflection points were the period around 13 March 2020 when gatherings of 500 people or more were prohibited; 25 March 2020 when Stage 3 lockdown measures were imposed in all states; the first week of May 2020 when the progressive easing of restrictions commenced; and, for Victoria, the week commencing June 22.
In that week, restrictions in Victoria were once again increased rather than eased, though not back to the same levels as the original lockdown conditions for most of Melbourne and the regional areas. For a small part of Melbourne, though, a hard lockdown was imposed at the end of that week and the confidence of the city’s population suffered a significant setback.
Regional, sub-regional and outlet centres are all now at around 80%-90% of their pre-Christmas visitation levels and the strong rebound in visitation to outlet centres – which were generally the most severely impacted by the restrictions – is evident
A breakdown of the trends by centre type is presented in Charts 3 -5, showing the variations on a state by state basis for regional centres, sub-regionals and neighbourhood centres respectively.
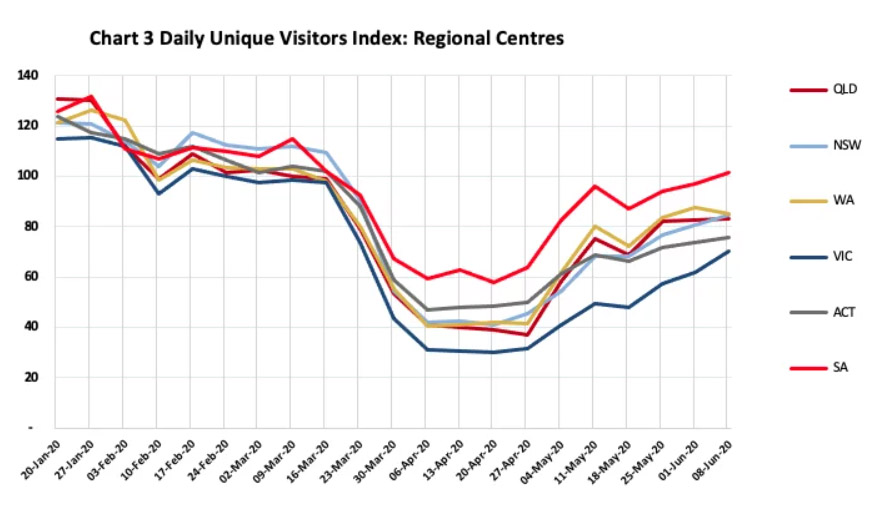
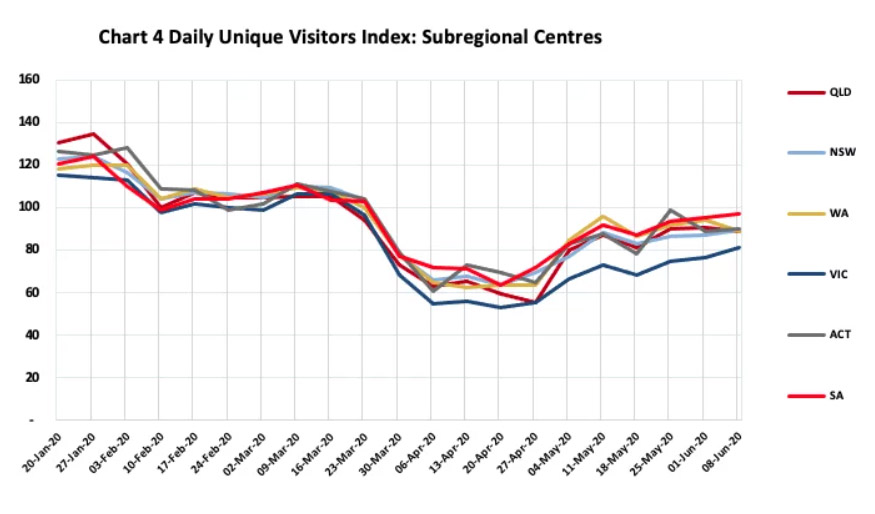
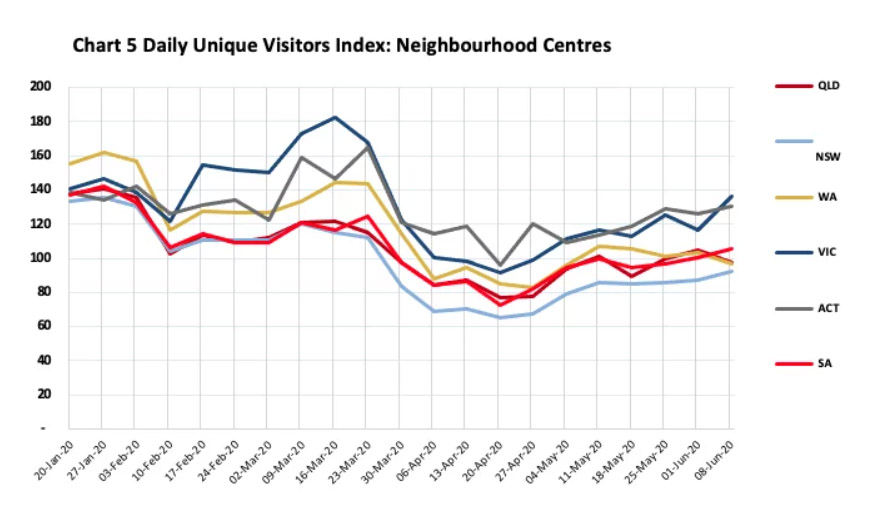
The important role played by the neighbourhood centre, especially in Victoria, over the lockdown period and the evidence of panic shopping around mid-March primarily via neighbourhood centres, show up in the above trends. The steady recovery for all centre types across all states is also becoming evident, including for regional centres in Victoria which are quickly closing the gap on regionals in other states.
Mobile device data offers great flexibility because every observation is date stamped and contains both a point of origin (anonymised) and a destination – the destination being the shopping centre or area selected for analysis. Therefore, these data can be used very effectively to measure not just the broad changes in total visitation patterns but also the changes which have occurred by place of origin (e.g. trade area sector) and by time of day or day of the week.
Chart 6 below shows, for example, that one of the outcomes of the restrictions on shopping movements imposed as a result of COVID-19 was a desire to stay closer to home, thus the proportion of total centre customers who live within a distance of 5 km of the centre increased quite significantly across all centre types between mid-March and late May.
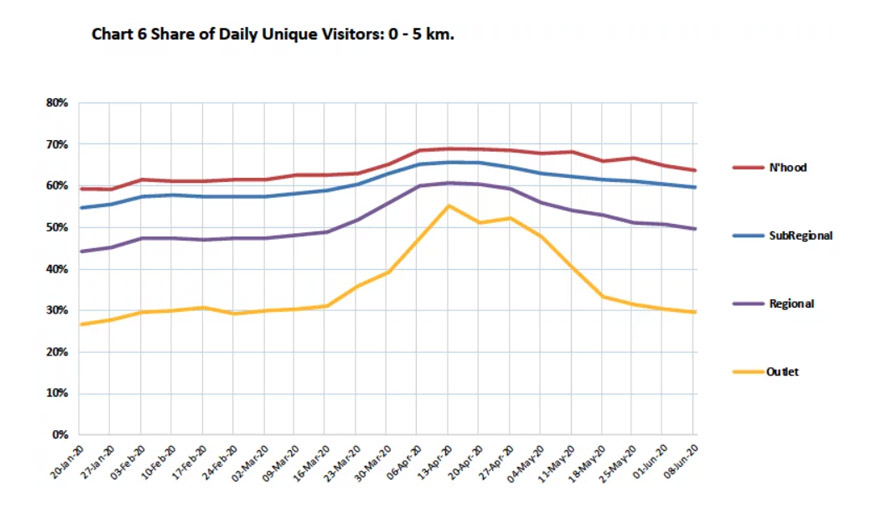
Whether the changes evident in visitation patterns and buying behaviours will be permanent or temporary has been one of the questions exercising the minds of all involved in shopping centres. At this point the mobile device data suggest that a return to normality as previously understood, or something close to it, is more likely than less likely. Already, for example, outlet centres are almost back to pre-COVID-19 patterns while most other centre types appear to be heading steadily back to a similar outcome, as shown in Chart 6. The slowest category to move back at this early stage appears to be Subregional centres.
We should know within the next few months whether there is likely to be a ‘new normal’ in shopping centre visitation patterns, but my early bet is that any lasting changes are likely to be quite minor.
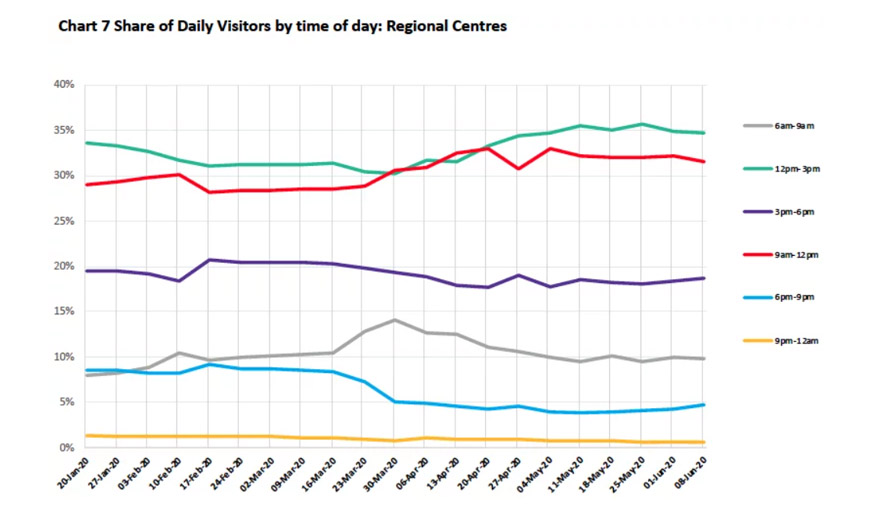
The device data can also be used to examine changes in visitor patterns by time of day, as Chart 7 below shows for regional centres. During the shutdown shoppers visiting regional centres clearly concentrated those visits into the morning period to a much greater extent than was previously the case, while correspondingly early afternoon visits and late evening visits have fallen off significantly. On this point the return to the previous normal appears to be noticeably slower though the return to workplaces, as and when it occurs, is likely to be one of the most important drivers to change back to fewer morning visits and more evening visits.
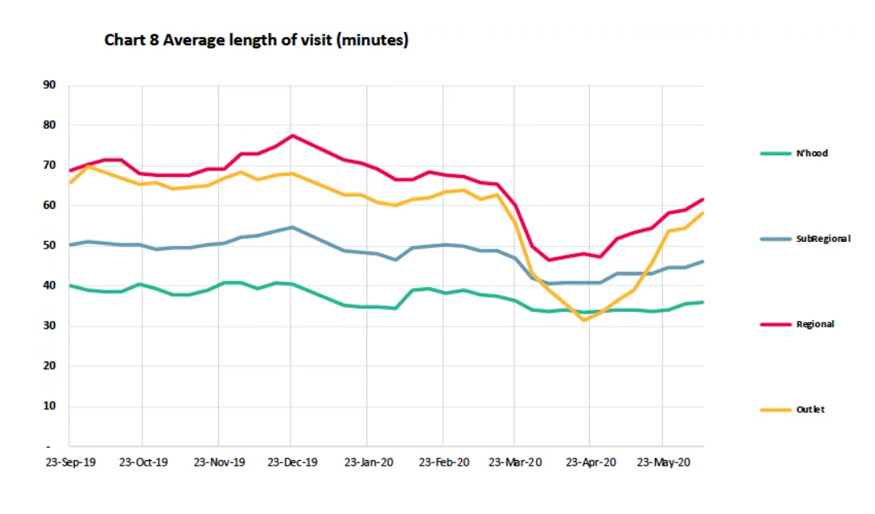
Unsurprisingly the duration of visit is another measure which fell dramatically during the restriction period, but again is returning back to pre-COVID-19 levels quite rapidly, especially for the highly discretionary shopping destinations, Regionals and Outlet centres, as shown in Chart 8 below.
There is no doubt that the COVID-19 pandemic has inflicted great short-term harm on the shopping centre industry as it has on most sectors of the economy and for some players, in particular some retailers, the additional pain could sadly be the straw that breaks the camel’s back.
However, the early evidence as restrictions are gradually eased is that visitation patterns are more likely than not to return to the old normal or something close to it. Expenditure tracking by groups such as Quantium, NAB and CBA similarly suggests that the early signs are relatively positive. There might even be some silver lining for bricks-and-mortar retailing as the social and community benefits of the regular visit to the shopping centre have clearly been greatly missed by consumers who now appear eager to re-embrace the opportunity to go back.
In my view there has been some tendency over the past few months to conflate the short-term impacts of the pandemic with some well-established long-term trends that are playing out, and will continue to play out, in the retail sector. Perhaps that was understandable given the depressing global statistics, and certainly the impact of COVID-19 should not be understated, in particular the likely hit to consumer expenditure over the next year as unemployment and under-employment levels are likely to remain high for some time. However, the available evidence suggests that the shopping centre industry is slowly but steadily making its way back albeit with remaining challenges likely for some time.
Mobile device data offer the opportunity to continue tracking the recovery period, to understand the nature of the changes and also whether or not visitation patterns are transitioning back to the old normal or will settle into some form of new normal, for each type of centre.
Importantly, mobile device data can also be utilised for any specific centre to measure any or all of the above, and then to compare or contrast that centre’s performance with the relevant benchmarks for its peer centres.