4 Ways To Use Visitation Data or 'People Movement Data' To Make Better Location Decisions
Visitation data or ‘people movement data’ is the act of better understanding the movements and behaviour of the visitors to a specific location. Fundamentally gaining insight into what stores or POI (point of interest) a shopper visited before and after visiting a particular store.
This information is critical for network planning decisions, business growth and understanding the types of people the store in question appeals to. After visualising and understanding the data provided by visitation data and then combining it with other geo data, it’s possible to evaluate the best locations to grow a store or franchise network. Ensuring the correct POI are nearby and that the right audience can reach the new store conveniently. These critical insights can also be used to help sales and marketing teams with the best locations for promotions, experiential popups or agent networks. Having the correct market planning information means you can make informed business decisions based on empirical data.
Below we have listed four ways to use visitation data to make better location decisions.
- Better understand your customers with Visitation Data
- Better optimise your marketing strategies with Visitation Data
- Better identify network cannibalisation with Visitation Data
- Gain a better competitive advantage with Visitation Data
1) Understand your customers
It’s common knowledge that it takes fewer resources to retain a customer than to attract a new customer. And understanding your current customers is the key to success. Visitation data helps build a better understanding of their journey to and from your store. Historically marketers used market research in addition to store-captured research to learn where their customers lived. However, we now know that where a customer works, takes their children to or visits frequently has a huge (if not larger) impact to what and where they spend their money.
Understanding what attributes drive a successful location can help you make superior decisions on selecting a new location and develop a network strategy.
Map visualisation location-intelligence platforms like GapMaps can integrate with visitation data to display the movement data of customers visiting a specific location. We can visualise the common locations visited before and after to understand if the store in question is frequented after University, after dropping off children at childcare or even before a hospital visit or flight. In some cases, it’s discovered that parents purchase their child a meal from a well-known QSR/FF and then stop to get their own meal from another restaurant.
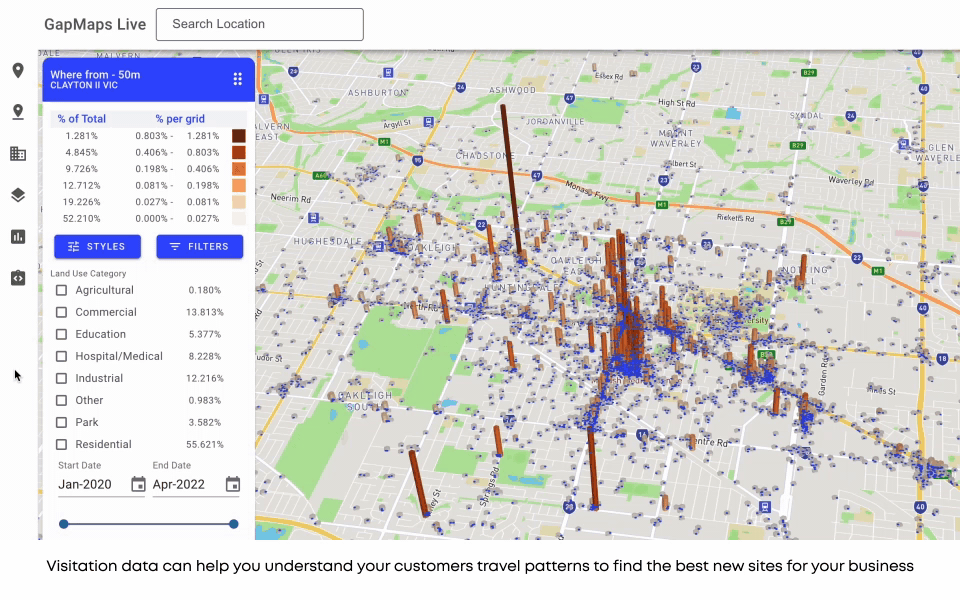
Visitation data adds further layers of insight and understanding into catchments. (learn what a store catchment is here). We can identify travel time from specific POI, which can help you find your next optimal store location. For example, your drive-through cafes that are within five minutes’ drive of a primary school (in traffic – on weekdays) do best. You can understand where your detailed demographic profile of your customers frequent – not just live, but where they spend their time and their money. This use case applies to many sectors, such as restaurants, cafés, recreation, and large-format retail.
2) Optimise marketing strategies
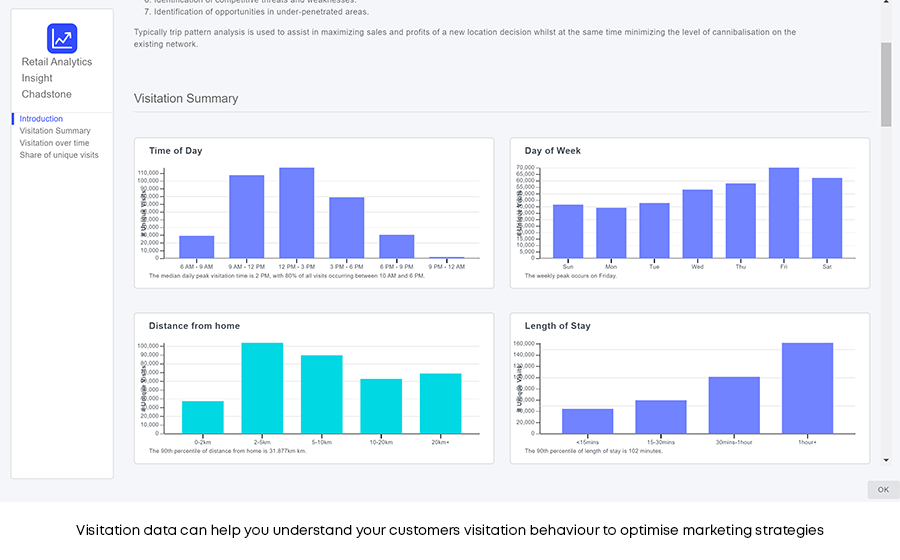
Visitation data is a marketer’s best friend, a great tool for consumer behaviour. As the world adjusts to the ‘new normal’, bricks-and-mortar store marketing teams need real-time data to help guide marketing strategies for 2023 and beyond. Many retailers, QSRs, Fast Food restaurants and Cafe’s already collect consumer information in various measures, including membership signups, by postcode questions when purchasing and by sending deliveries. This information is still critical; however, matched with visitation data, marketing can see the bigger picture. Visitation data can provide information on dwell times and frequency of visits. Integrating this data with daily sales can paint a picture of why stores are or aren’t performing – and how to increase revenue. The benefits of visitation data for marketing teams:
● Own data rather than relying on 3rd party market research teams
● Monitor the difference when promotions are run. Are these the same shoppers or do we have a different kind of shopper who purcahses at our sales?
● Learn the types of people who travel to your store and why by seeing their movement data
● Learn the POI (places of interest) that complement your stores
● Gain better insight when a store stops performing
● Understand shopper behaviour based on weekday and time. Does your store attract different types of people at different times? Is there a possibility to build on these learnings? Could young parents dropping kids off at childcare be rewarded with a free coffee from 10-3, because you know they’re likely to be at your store for an hour with cake and many more coffees?
● Benchmark visitation data intel to understand key business drivers across the entire network and compare what successful stores look like.
●Better plan your marketing and media plans. While visitation data can be used to target geographically both digitally and traditionally, when it comes to outdoor – visitation data is a brilliant tool for understanding specific routes taken by existing customers. Allowing you to target during peak time to a captive audience.
4) Identify network cannibalisation
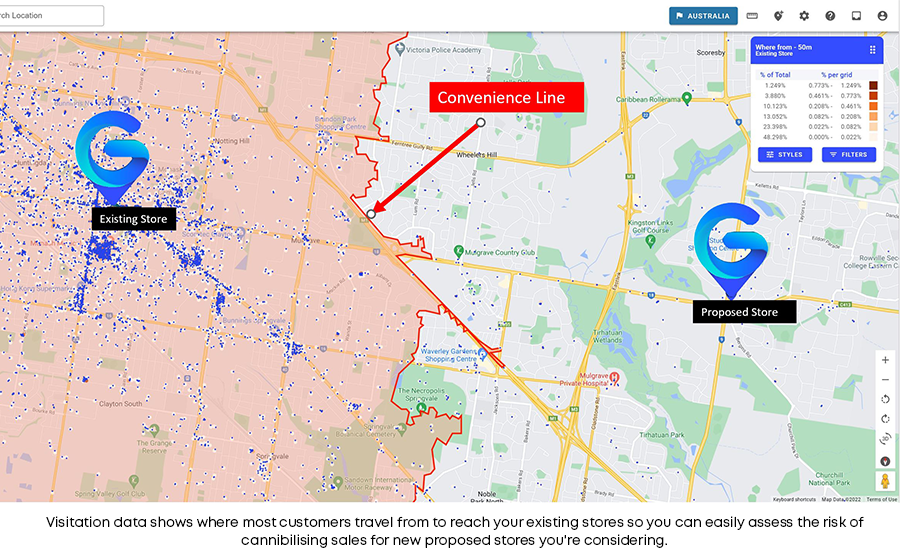
Cannibalisation refers to a new store in a network taking away customers from an existing store in the network. It’s a fine line. You could be missing out on sales with a network of stores that are too far apart. Using visitation data to understand where your customers are coming from – in contrast to just understanding where they live, means you can create more informed catchment areas. Reducing the risk of cannibalisation while having the ability to jump on opportunities and capture more of the market. Visitation data allows you to optimise your store network or franchise network so that each store is the perfect distance from the rest of the network.
You can use visitation data to visualise the density of customers within the catchment areas of your existing locations and accurately determine whether there’s an opportunity to open new locations or whether it would be more profitable to consolidate.
You can minimise cannibalising your network and maximise your sales using visitation data to help answer these questions:
● What is the estimated percentage and dollar value impact on an existing store if a new store is opened nearby?
● Is there overlap across my existing stores and potential consolidation opportunities?
● What is the average drive time distance between stores to minimise impact?
● Should a store be company owned or allocated to a franchisee, and if it is a franchisee, then which franchisee should be offered the store?
4) Gain a competitive advantage
One of the strongest capabilities of visitation data is its ability to provide actual people movement insights. You can get data on any location by simply defining the boundaries you want to study of any site/store or precinct.
You can use visitation data to measure your own store performance by observing:
● What is the best location in the market and where are the white space opportunities, relative to your existing store network?
● Where are customers coming from and what are the major drivers of customer trips?
Naturally, you can also get all this information on your competitors’ stores which is a powerful strategy to seek a competitive advantage and respond strategically or tactically.
When you use this location intelligence to better understand and attract your ideal customers, you are proving the value of smart visitation data.
So what exactly is visitation data?
Imagine a restaurant, café, supermarket or shopping centre — every day hundreds of people visit from all over the city. Everything about their visits is unique to them, but collectively, there are clear patterns in their movements, intentions, motivations and behaviours.
This is visitation data. It’s highly detailed data concerning people and places. It can shed light on their visitation patterns (“where from” and “where to”), frequency of visits, profiles of consumers and much more.
Understanding the “where from” and “where to” trip pattern, and where people live, work, shop, recreate, travel, learn and play are fundamental to understanding what drives people to any given location.
What kind of questions can visitation data answer?
Visitation data is very powerful and can help you answer questions like these:
● What is the demographic profile of customers visiting my locations?
● What is my primary catchment? And where within that catchment do most of my customers travel from to reach my locations?
● What key local generators drive customers to my locations (ie. work, shopping, recreation, hotel or education facilities that are in the area) ?
● How far do my customers travel and what is the distance decay (ie. distance beyond which most customers stop visiting as it is too inconvenient to visit regularly)?
● Where are the potential gaps in my network for new developments?
● What is the sales impact on an existing store if a new store is opened nearby?
● Is my marketing strategy targeted to the right audience?
● Where are my competitor’s customers coming from?
Mobile data provides more accurate data to understand real-time visitation patterns
Visitation data uses location data on mobile phones which is steadily collected from smartphone apps when the users have given their permission to track their location.
Mobile data has been a game-changer because it isn’t modelled or extrapolated — each data point represents real action by a person. Yet, the data is flexible and customisable enough to explain the nuances of customer visitation patterns.
For example, say your business was observing highly variable foot traffic on different days of the week or times of day. By drilling down into the mobile data, you can measure where your business/ centre draws customers from by time of day and day of week to explain the variability and understand how marketing campaigns or external factors are impacting your stores.
Visitation data allows a superior approach to competitive analysis
It would be impossible for one business to understand where a competitor’s customers come from unless using in-store survey results. But mobile technology can provide insights that can make competitor analysis far more productive.
You could conduct an in-depth analysis of the full competitive landscape around your store. Mobile data can be used as a standalone modelling strategy or as a supplement to other datasets.
For example, you could choose to do an in-store survey of customers for a handful of store locations to ask some qualitative questions but use mobile data for the rest. It’s possible to calibrate that data to deeply understand the drivers of current store performance and identify potential new store locations with the best likelihood of success.
The benefits of visitation data
Visitation data provides a host of benefits and qualities that make it a valuable addition to location intelligence services:
● Real-time
● Low-cost at high scale
● Accurate
● Flexible
● Non-proprietary
● Empirical
Highest quality visitation data insights with GapMaps Live
GapMaps knows the importance of data quality and validity. That’s why we partner with Near — the world’s largest privacy-led data intelligence platform which tracks over 1.6b mobile devices across 44 countries.
Near have created robust screening methods to evaluate the quality of location data collected from multiple sources to ensure that their data lake contains only the highest-quality location data. This includes partnering with trusted location SDK providers that get proper end user consent to track their location when they download an application, can detect device movement/visits and use GPS to determine location co-ordinates. Data received from partners is put through Near’s data quality algorithm discarding data points that receive a low quality score.
When doing any sort of analysis using location data, it is also critical to have confidence that a location visit is actually a visit. For this reason, we spent the past 4 years testing and refining mobile device data from Near to ensure the outputs we make available in GapMaps Live only include observations where we know the device origin prior to the visit, the visit dwell time and the device destination after the visit,
This level of accuracy has been verified with actual customer research studies used to gather customer visitation insights; against sales potential data provided by retailers and landlords and against cannibalisation impacts provided by clients for new store openings.
And how could you use that visitation data? Here are four use cases as examples.
Curious to know how visitation data can help you? Let’s chat.